Who said vim is not an IDE?
Preparing vim for IDE like experience
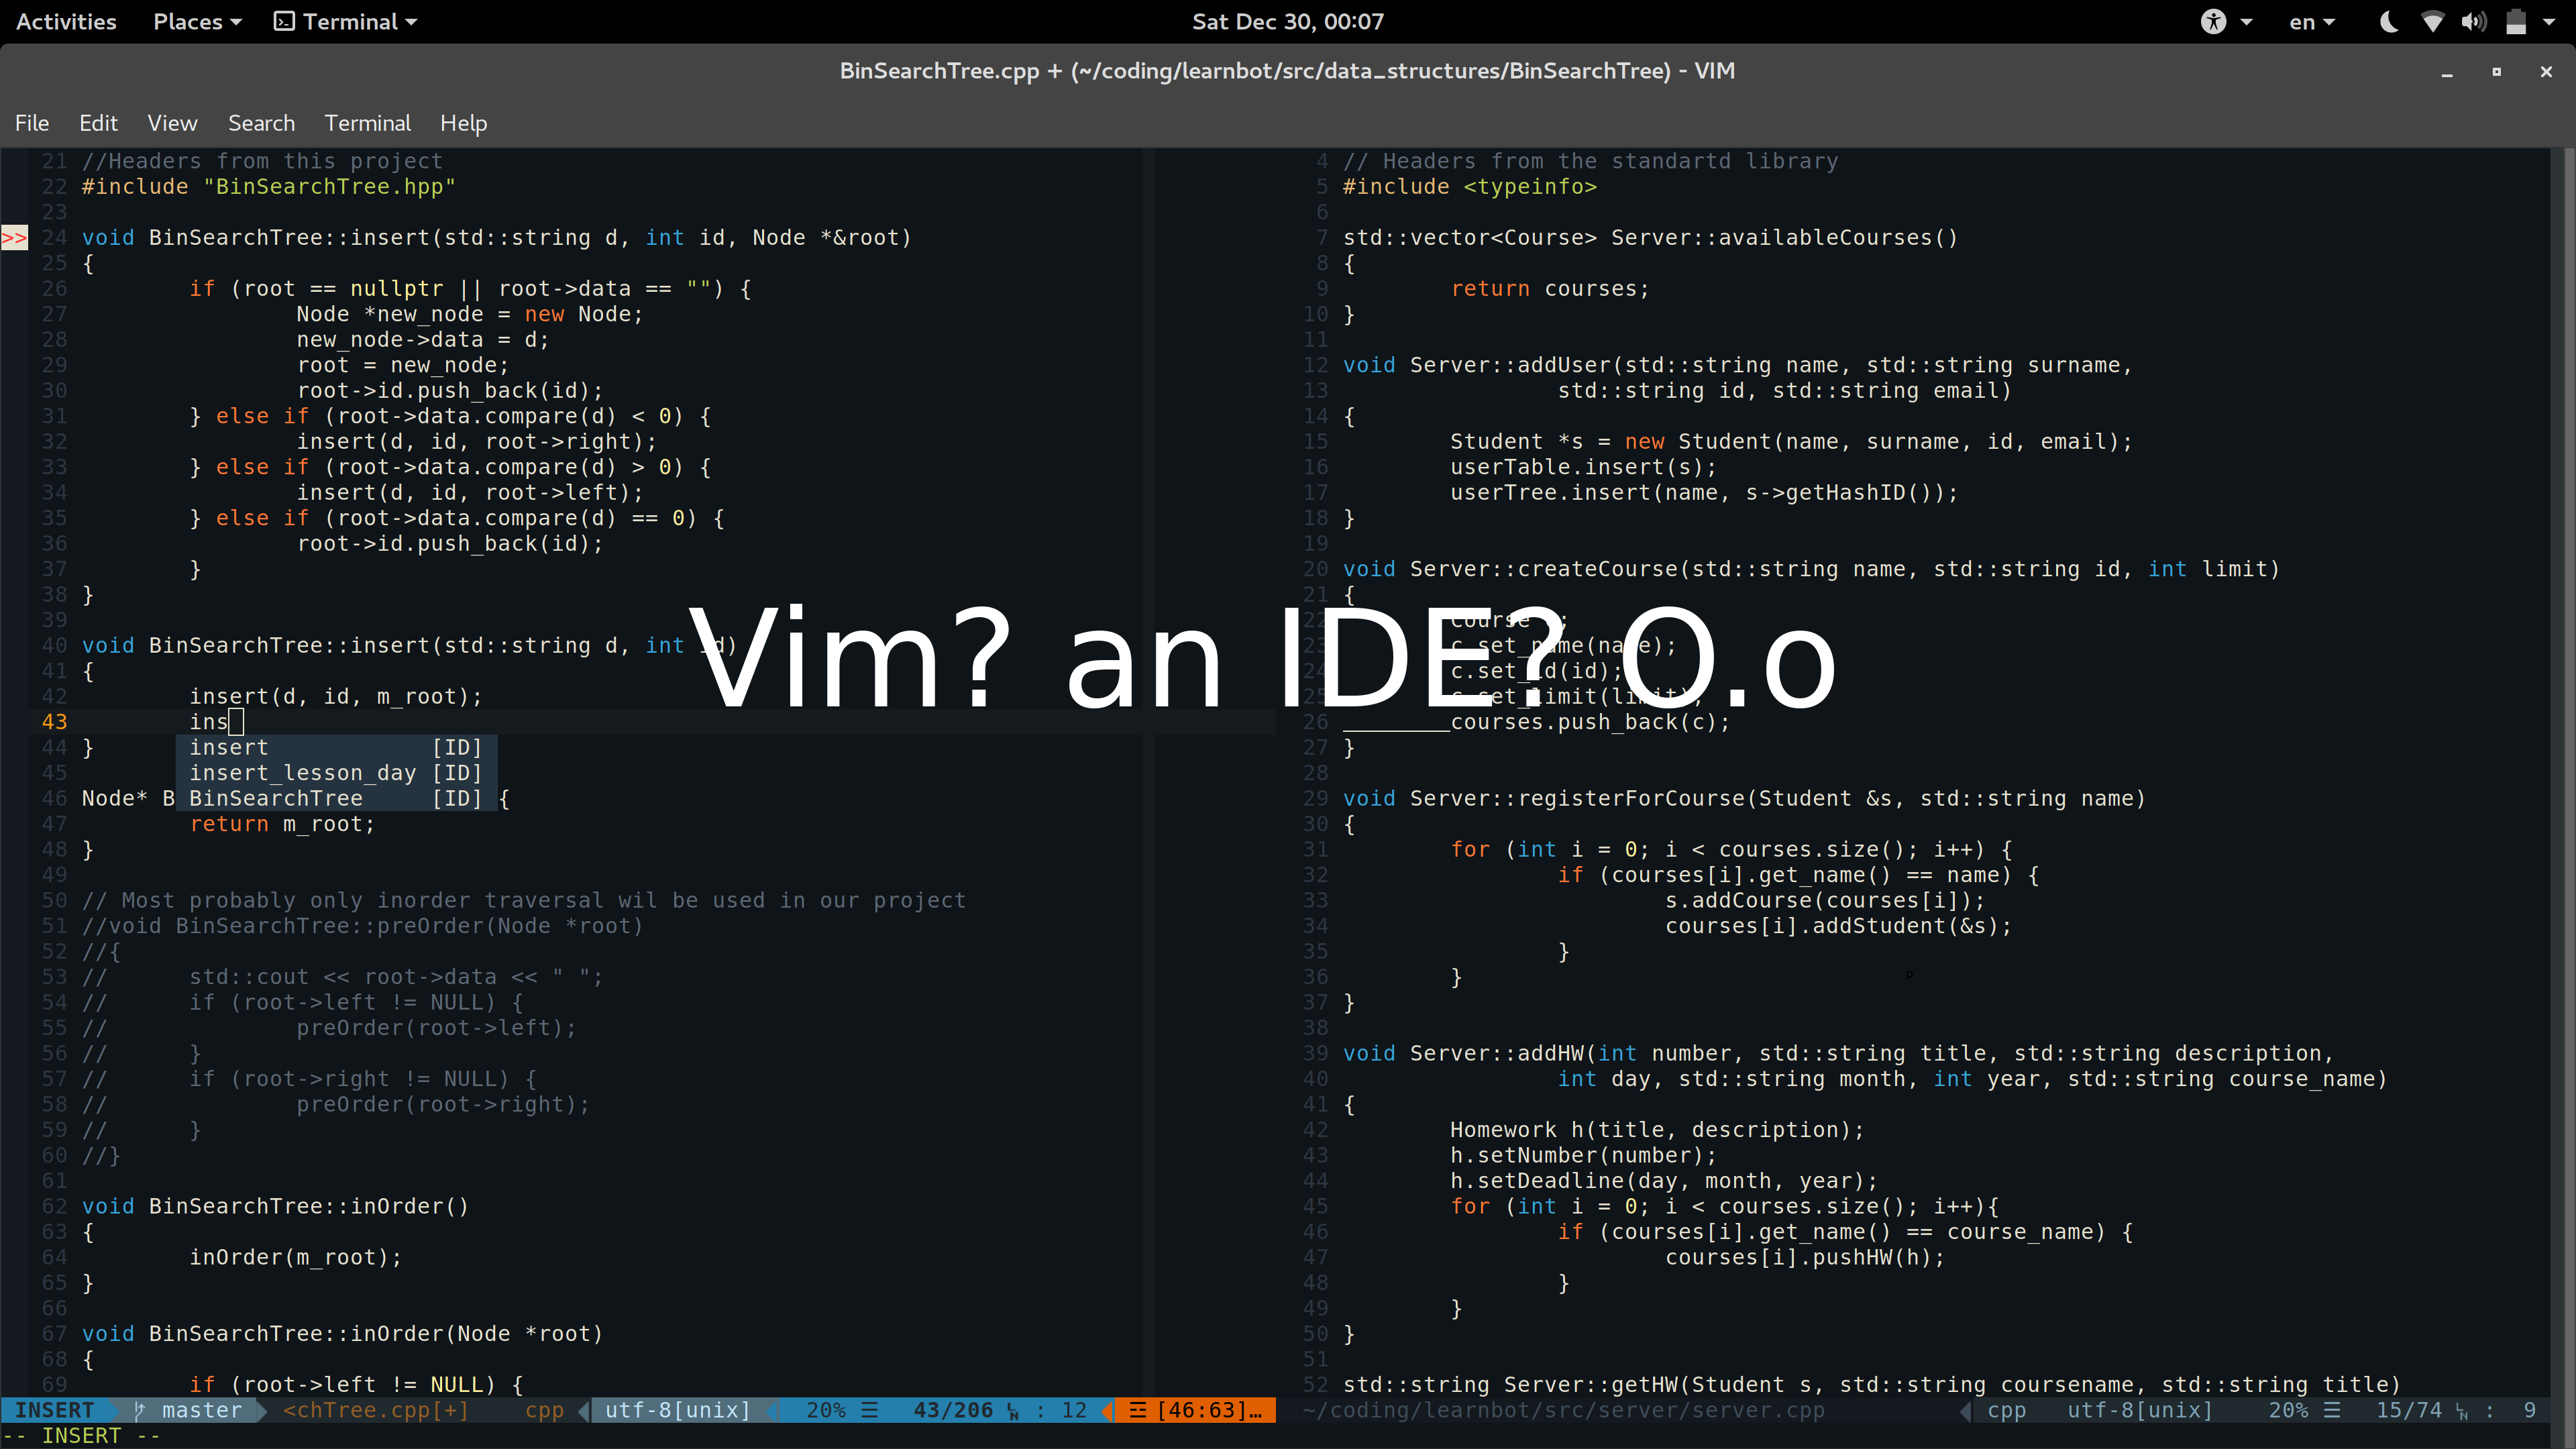
Every developer has a favorite text editor or an IDE, and as long as developers exist, Text Editor wars are not going anywhere. The two main forces of the so called “Editor War” are Vim and Emacs. They are both great and can do a lot, but… but they are not an IDE.
I’ve heard many developers, who are in love with vim or Emacs, but use IDEs like clion, CodeBlocks, VisualStudio, etc., because of certain features.
But wait! What if I tell you that you can turn your vim or Emacs into an IDE? Yes, it will work, and in majority of cases it will work better and faster than your traditional IDE, at least for C/C++ it does.
Configuring vim to become an IDE
Well, the main basic features of an IDE are
- Code completion
- Error detection
- Debugging
Of course there are many more features that IDEs have, and it is possible to configure vim to do most of them, but in this post I will only speak about these main three.
So let’s look at each feature and try to make it work in vim
Note: The configuration is for C/C++, but with light modifications and right plugins it is possible to make them work for your desired language.
Code completion
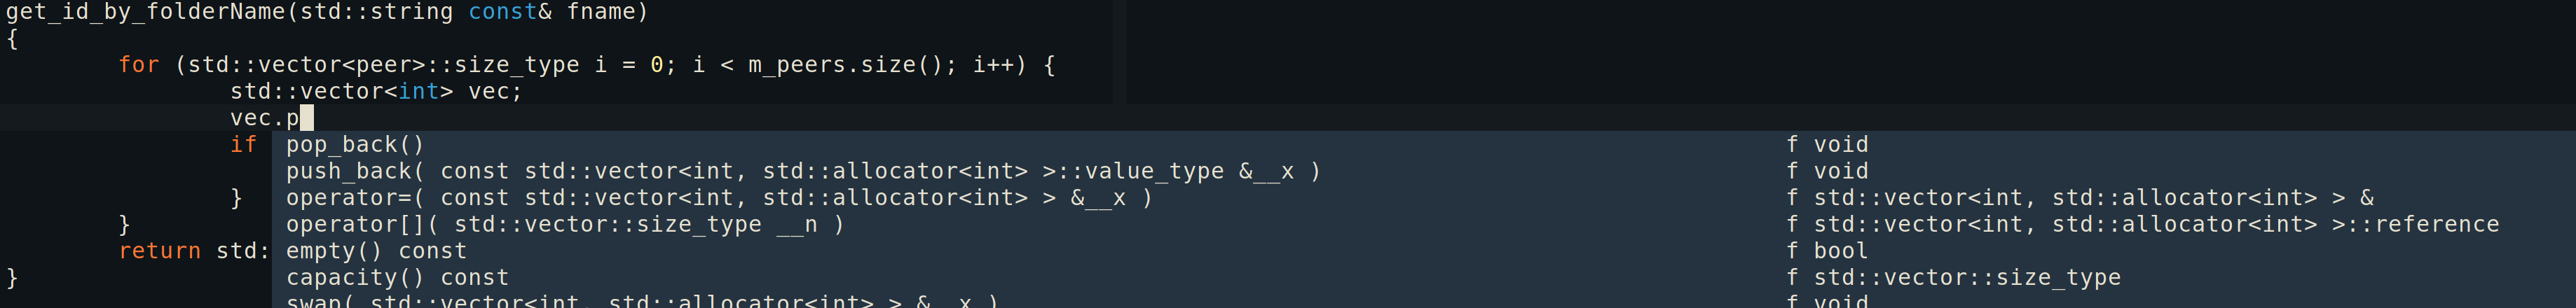
Vim already has a built in code completion and all you have to do is type the
starting letters and press crtl + n, and it will bring suggestions from your
code. But that’s not enough. All IDEs have smarter code completion, which will
bring suggestions not only from the code you’ve already written, but from the
libraries you use.
You can achieve such feature with a vim plugin called YouCompleteMe.
All you have to do is install the plugin and configure for your desired language and libraries.
Error Detection
One of the things I like in Vim when you make your code from it, in case of
errors it brings the cursor on the line, where the first compile error occurred. However,
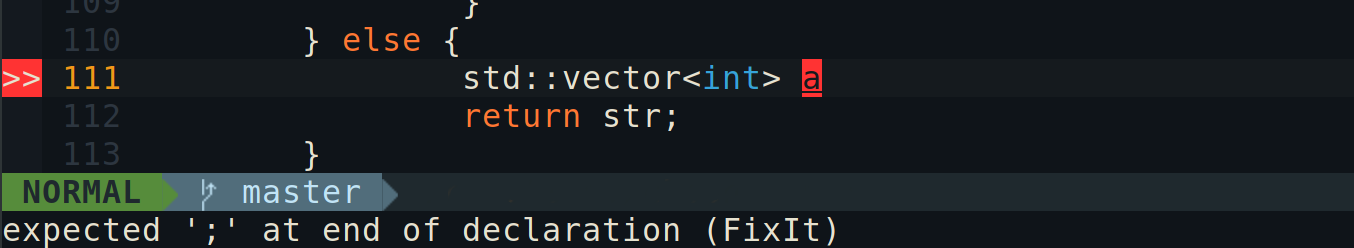
the IDEs do a lot more than that. They detect the errors, right after you type
them.
For vim, the same functionality provides the
YouCompleteMe plugin, discussed
above. After typing, when you press the Esc key, in case of compile errors it
will highlight the code parts causing the errors.
Debugging
When I was just starting to use Vim, for debugging my programs I had to open
another terminal, run gdb, type ref and try to use not so user friendly
interface, without syntax highlighting. When writing command I couldn’t even use
my arrow keys. Well, that sucked.
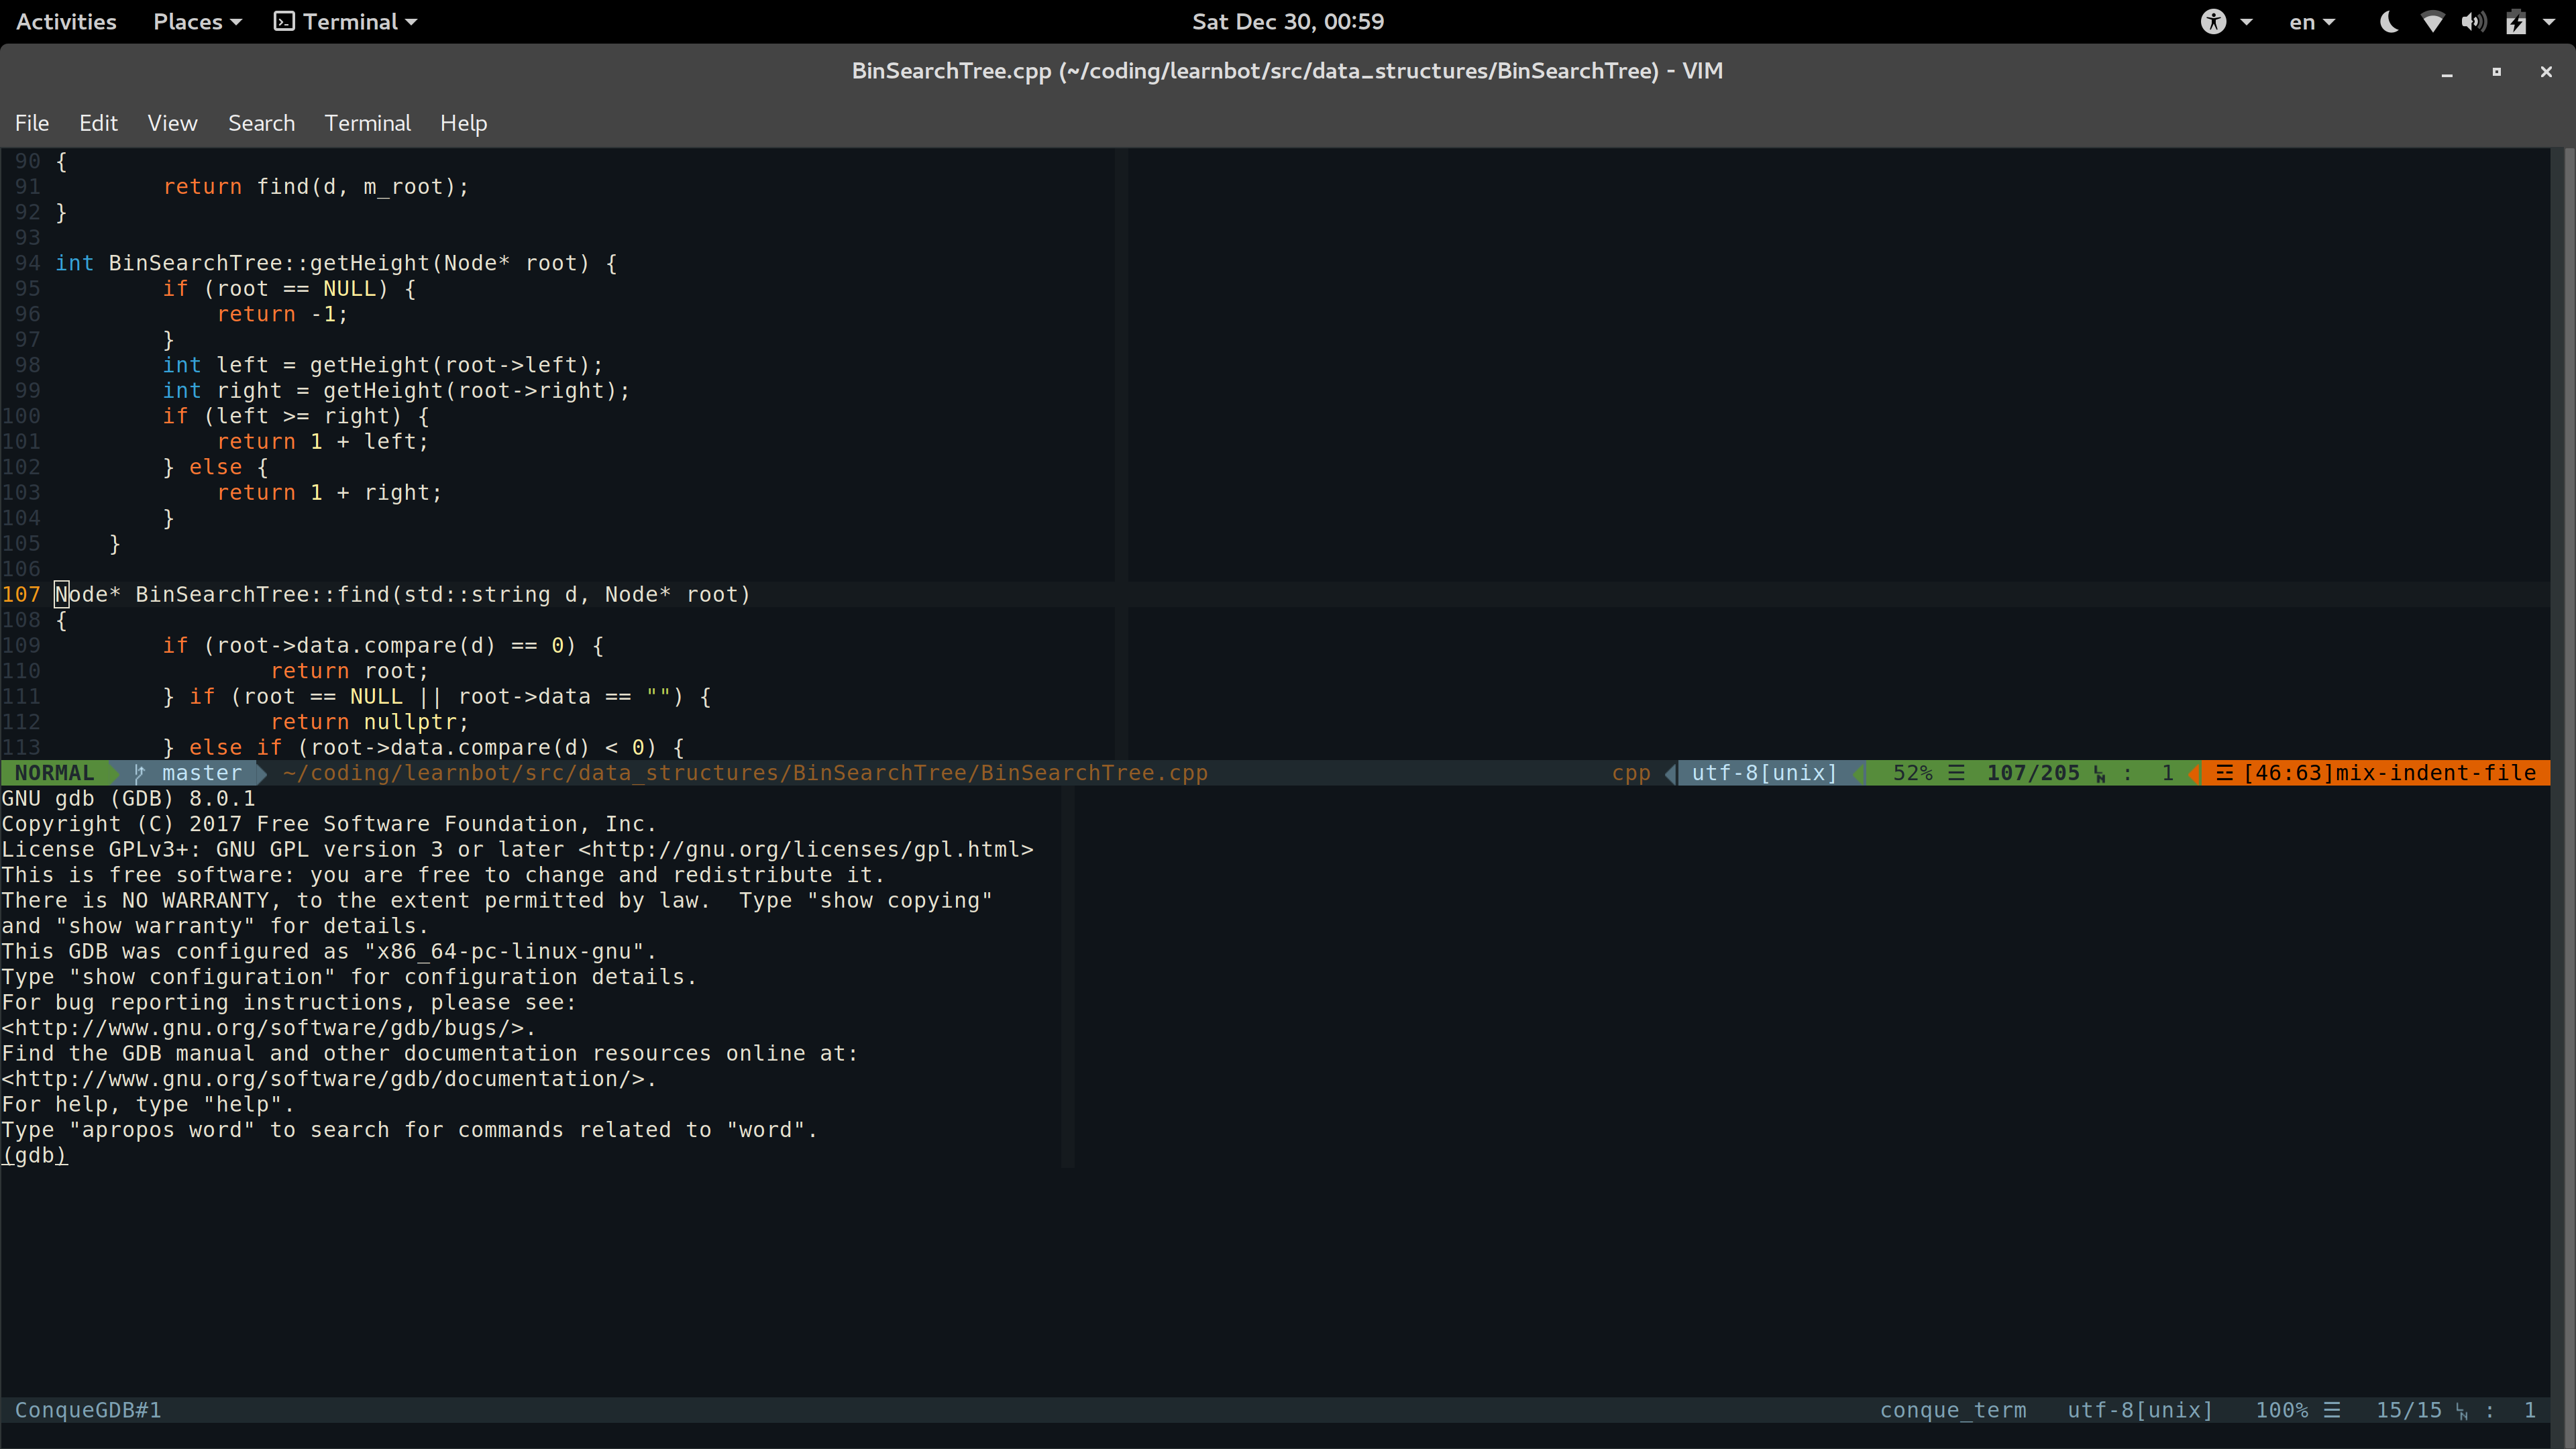
Then I discovered the Conque-GDB
Conque-GDB is a vim script that integrated GDB into your vim. Cool right? What’s more cool, is that it shows the breakpoints or segmentation fault location right on your code in vim. You can even use your arrow keys moving your cursor!
I will be honest, I hated GDB even after using this plugin, until, one day, during a Programming Olympiad I had to use Visual Studio’s debugger. Well I couldn’t even find where my program threw a SegFault. So what I did (I don’t even know if I had the right to do so) was to boot Linux from my USB and use Conque-GDB.
Other plugins?
There is a very awesome website full of various vim plugins, called vimawesome.com. You can find many many more plugins there and make your vim much closer to an actual IDE.
BTW this was my first blog post, so I am waiting for your positive criticism in the comment section.
Twitter
Google+
Facebook
Reddit
LinkedIn
StumbleUpon
Pinterest
Email